- Visibility 71 Views
- Downloads 26 Downloads
- DOI 10.18231/j.ijfcm.2022.022
-
CrossMark
- Citation
Chest CT imaging as an essential tool to detect the severity of COVID-19 infection in patients and its correlation with RT-PCR
- Author Details:
-
Vineetha Kolar Venkataravanappa
-
Anand Sorikunte Huchappa *
-
Kambathanahalli Paramashivaiah Suresh Babu
Introduction
The World Health Organization China Country Office reported cases of pneumonia of unknown etiology in Wuhan in 2019, after which it was named Coronavirus disease 2019 (COVID-19) becoming a global threat. To prevent its rapid spread, early and accurate diagnostic tools for this disease became important.[1]
Real-time polymerase chain reaction (RT-PCR) which detects viral nucleotides from the samples remains the standard test of COVID-19 pneumonia.[2] Specimens are obtained by nasopharyngeal swabs, oropharyngeal swabs, bronchoalveolar lavage, or tracheal aspirate. However, standby time for viral detection with RT-PCR tests, incomplete sampling techniques, variations in viral load, and false-negative rates of a test depending on the kit sensitivity can delay the diagnosis. It has been reported that positivity develops in the second, third, or even subsequent tests where the initial test was negative.[3] There are also cases in the literature with multiple negative RT-PCR test results from nasopharyngeal samples that are positive in tests using bronchoalveolar lavage (BAL) samples. Apart from these, recent reports revealed that RT-PCR has sensitivity as low as 60-71% for detecting COVID-19.[4] Although the symptoms of the disease may be similar to those of other viral infections, differences in imaging findings can facilitate the differential diagnosis.[5]
Imaging techniques including radiography and computed tomography (CT) have gained importance for disease diagnosis. Radiologists have detected common CT findings of COVID-19 pneumonia that are mostly ground-glass opacity (GGO), consolidation and crazy-paving pattern, and less commonly subpleural curvilinear line, air bubble sign, halo and reversed halo sign, air bronchogram, airway changes, and fibrous stripe formations.[6] By contrast, chest CT has demonstrated about 56-98% sensitivity in detecting COVID-19 at initial presentation and can be helpful in rectifying false negatives obtained from RT-PCR during the early stages of disease development.[7]
RT-PCR for COVID-19 can only tell if a person is currently infected with this coronavirus. It can’t provide information on other diseases or symptoms. Focus on the importance of chest CT as it is non-invasive. It can be used to overcome false negative results of RT-PCR.CT signs gradually improve beginning approximately 14 days post-symptom onset.[8] One must rely on CT scan for detecting the severity of the infection. Both the techniques are important because live RT-PCR positive and zero CT score can’t tell confirmatory diagnosis of covid. RT-PCR and CT-scan cannot replace each other but both techniques are important for accurate diagnosis and the treatment of the disease.
The study was conducted to establish the importance, effectiveness, and co-relation of both diagnostics methods in the detection of COVID-19 infection.
Materials and Methods
Patients and study design
In this prospective study a total of 979 patients (Male= 614, female= 365) from Tumkur, Karnataka (India) who were suspected of novel coronavirus infection and underwent both chest CT imaging and laboratory virus nucleic acid test (RT-PCR assay) were retrospectively enrolled in the hospital.
Patients with positive RT-PCR reports and abnormalities in chest CT images were identified. To identify the accuracy of each technique for early detection of the disease, the following criteria were applied, a) patients tested COVID-19 negative by RT-PCR but positive in chest CT. b) patients tested positive by RT-PCR but negative with chest CT and c) patients positive in both detection techniques.
RT-PCR test for detection of COVID-19
Nasopharyngeal and oropharyngeal samples from sympatric patients were collected and subjected to RT-PCR analysis The RT-PCR assays were performed by using Biorad RT-PCR (Thermal cycler with 96-well reaction module). Patients with positive RT-PCR reports were identified.
Chest-CT scan and image analysis
CT scans were performed in the supine position using Toshiba alexion 16 slice CT system(1 mm slice thickness). CT was performed with the patient in the supine position during end-inspiration. Two radiologists (with 10 years of experience) reviewed the CT images and agreed by consensus. The CT scans of all patients were analyzed. Depending on the severity of the chest infection, the scores were assigned.
Statistical analysis
Initially, the data were screened to find the distribution of the data using the Kolmogorov Smirnov test. Based on the obtained results, the data were presented by means of descriptive statistical methods but not limited to the below mentioned was employed as required and as appropriate. To further establish the relation amongst the parameters, inferential statistics with suitable correlation/association methods were employed. The central tendency of continuous data was expressed as mean±SD. The categorical data were represented as their corresponding frequency (percentages). The following statistics were used to calculate the significance difference between the two groups with Chi-Square Test/McNemar Test for the nominal (categorical) unpaired/paired data and association between the two nominal (categorical) data was assessed using the phi-test.p < 0.05 was considered for all the statistical significance.
Results
A total of 979 patients were included in the study. Out of which 614 (62.72%) were male and 365 (37.28%) were female. The majority of the population was from the age group 36-55 years (44.73%) followed by 26-35 years (31.1%). The mean age of patients included in the study was 43.69±14.86. Comorbidities such as diabetes, hypertension, asthma, and heart problems were considered during the study ([Table 1]).
|
Parameter |
Frequency |
Percentage |
Mean ± SD |
|
Gender |
|||
|
Female |
365 |
37.28% |
- |
|
Male |
614 |
62.72% |
- |
|
Total |
979 |
100.00% |
- |
|
Age |
|||
|
Overall |
979 |
100.00% |
43.69 ± 14.86 |
|
Below 18 Years |
14 |
1.43% |
12.36 ± 4.41 |
|
18-25 Years |
82 |
8.38% |
22.73 ± 2.08 |
|
26-35 Years |
237 |
24.21% |
31.1 ± 2.79 |
|
36-55 Years |
427 |
43.62% |
44.73 ± 5.92 |
|
56-70 Years |
178 |
18.18% |
62.51 ± 4.13 |
|
Above 70 Years |
41 |
4.19% |
76.46 ± 4.43 |
|
Comorbidity |
|||
|
Asthma |
3 |
0.31% |
- |
|
Asthma & Diabetes |
2 |
0.20% |
- |
|
Diabetes |
63 |
6.44% |
- |
|
Diabetes & Heart Problem |
1 |
0.10% |
- |
|
Diabetes & Hypertension |
77 |
7.87% |
- |
|
Heart Problem |
8 |
0.82% |
- |
|
Hypertension |
81 |
8.27% |
- |
|
None |
744 |
76.00% |
- |
|
Total |
979 |
100.00% |
- |
|
CORADS Score |
|||
|
No Infection (0) |
86 |
8.78% |
- |
|
Low Infection (1) |
1 |
0.10% |
- |
|
Intermediate Infection (3) |
27 |
2.76% |
- |
|
High Infection (4-6) |
865 |
88.36% |
- |
|
Total |
979 |
100.00% |
- |
|
CT Index |
|||
|
Negative |
305 |
31.15% |
- |
|
Positive |
674 |
68.85% |
- |
|
Total |
979 |
100.00% |
- |
|
RT PCR |
|||
|
Negative |
366 |
37.39% |
- |
|
Positive |
613 |
62.61% |
- |
|
Total |
979 |
100.00% |
- |
Out of 979 patients, majority of the patients i.e., 614 (62.72%) were reported male and aged between 26-55 years. Majority of the subjects i.e., 744 (76.00%) were not seen with any comorbidity. Corads Score analysis revealed 865 (88.36%) patients with high infection. Out of all the infected patients, 674 (68.85%) patients resulted positive with COVID-19 from chest CT Scan method and 613 (62.61%) patients resulted positive with COVID-19 from RT-PCR method.
|
Test Result |
CT Index |
||
|
Yes |
No |
||
|
RT-PCR |
Yes |
603 (61.59%) |
10 (1.02%) |
|
No |
71 (7.25%) |
295 (30.13%) |
|
|
Statistic |
Value |
95% CI |
|
|
Sensitivity |
98.37% |
97.02% to 99.22% |
|
|
Specificity |
80.60% |
76.17% to 84.53% |
|
|
Accuracy |
91.73% |
89.82% to 93.38% |
The sensitivity analysis explained that the probability for obtaining the correctly classified positive results from both the methods was 98.37% with accuracy of 91.73% ([Table 2]). A high association (r=0.82, p<0.001) observed between both the methods were observed (0.82).
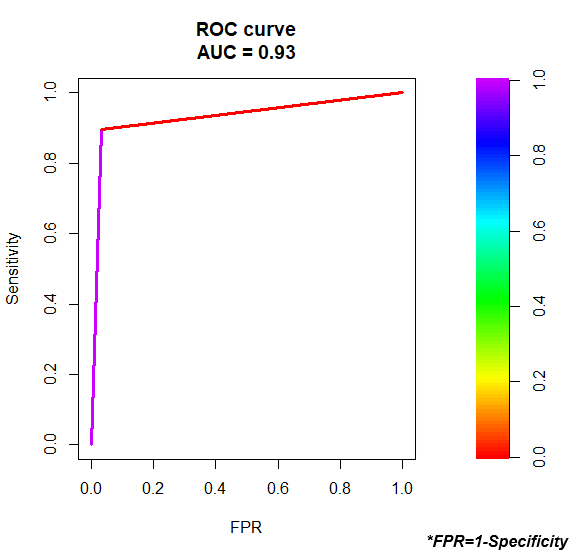
The area under the curve gives us an idea of how well the model can distinguish between positive and negative outcomes. The AUC can range from 0 to 1. The higher the AUC, the better the model is at correctly classifying outcomes.
The AUC for this regression model is 0.93, which is extremely high. This indicates that the model is well enough to predict whether the classifications were classified correctly. ([Figure 1])
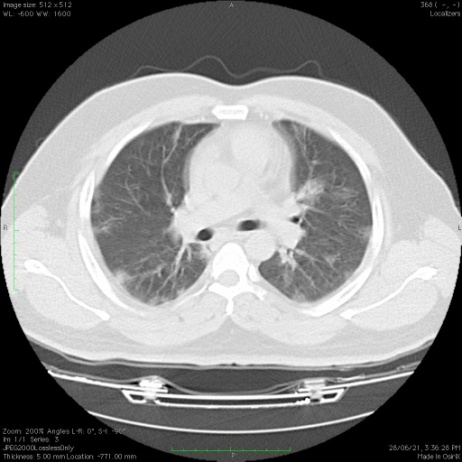
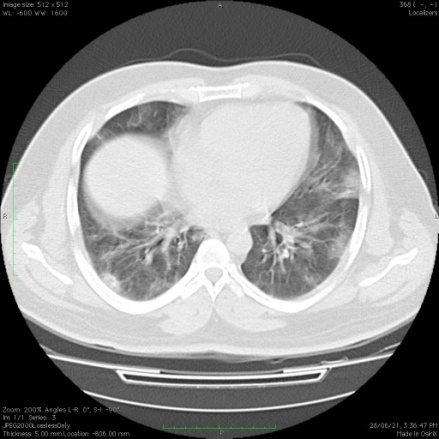
[Figure 2], [Figure 3] shows representative images of CT scans of two patients of two different age groups, 35 and 43 years old respectively, with a positive RT-PCR test. Multiple patchy areas of ground glass opacities were observed in the lungs indicating the spread of infection. The severity of infection was more (CT score 15/25) in 43 years old patient.
[Figure 4], [Figure 5] are other representative CT scans of two patients (28 and 18 years old respectively) whose RT PCR test was negative. CT scans in such patients revealed patchy areas of ground glass opacities in the lungs indicating the spread of infection. Both patients were showing severe symptoms of COVID-19 disease such as breathlessness, cough, and fever although detected RT-PCR negative.
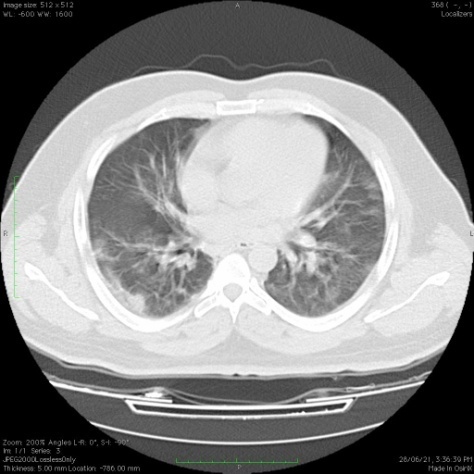
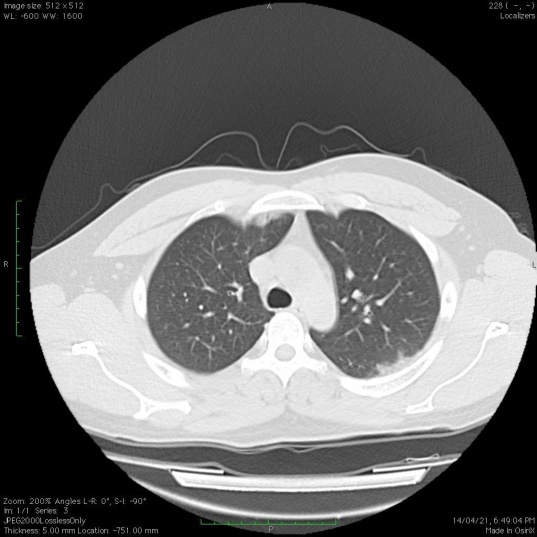
CT scan was observed in patients with positive as well as negative RT-PCR tests. Patchy areas of ground glass opacities are common in all the patients irrespective of RT-PCR results. CT scan shows more sensitivity and high accuracy for the infection.
Discussion
Every diagnostic test has its advantages and loop-falls. Therefore, for accurate diagnosis of a disease, multiple confirmatory pathological tests are required. Since its emergence in 2019, the topic has remained of a debate regarding the accurate diagnostic method for COVID-19.[9] RT-PCR, as the most used and widely accepted method, also resulted in false positive or false negative results in multiple suspects.[10] This may be because of human errors in multiple steps for example improper sample collection, low viral load, etc. therefore, a second confirmatory test should be recommended for accurate diagnosis of this disease.
In a study by Ai et al., 1014 patients were examined, and CT findings were detected in 308 patients with negative RT-PCR results. Bilateral lung lesions consisting of ground glass opacities and consolidations were detected in lung CT of these 308 patients. For patients with a follow-up RT-PCR test, the mean interval between the initial negative to positive RT-PCR results is reported as 4–8 days.[3] Our finding suggests that chest CT is relatively more sensitive than RT PCR. Relatively very few false positive (7.25%) and false negative (1.02%) reports were obtained from chest CT with RT-PCR as a standard test. While screening for chest CT, the patient’s co-morbidities such as asthma, and previous pulmonary disease history should be taken into consideration to avoid false positive results.
The CT scan images included patients whose RT-PCR reports were positive with changes in chest CT images. A male patient (35 years old) with cough and fever as prominent symptoms was RT-PCR positive and underwent a chest CT scan. Multiple patchy areas of ground glass opacities were observed predominantly in the sub-plural region. Similar observations were made in another patient who was 43 years old with a CT severity score of 15/25 and a positive RT-PCR test. This indicates that CT scan is sensitive and accurate for the diagnosis of COVID-19 and more insights into the spread of infection and extent of tissue injury can be diagnosed earlier.[11]
In another example, CT scan was carried out in two patients (One was 18 years old, and one was 28 years old). Both patients had negative RT-PCR reports, but it was shocking to observe the CT scan images of both cases. Multiple patchy areas of ground glass opacities were observed in subpleural location indicating the spread of the disease in the lungs. This highlights the need of CT scans to overcome and accurately diagnose the patients who are detected false negative from RT PCR tests. These cases support the statement made by Kohli et al. in 2021 that ‘CT scan may be a missing link in closing this pandemic’.[12]
Overall, our results suggest that a chest CT scan may be a useful confirmatory or secondary method to RT-PCR in the initial detection of COVID-19 in certain circumstances such as a doubtful RT-PCR report (symptomatic patient with a negative RT PCR). However, routine use of chest CT is of major debate regarding exposure to radiation, and the number of exposures should be considered. Pregnant women and small children should be exposed limitedly to such radiations therefore RT-PCR remains the best routine practice without any harm.[13] Routine use of CT scans for COVID-19 detection can bring overburden to the healthcare system. A major disadvantage of a CT scan is it requires the patient to be in contact with the instrument.
Therefore, in the case of COVID-19 suspects, the machine needs to be sterilized after every patient, which is practically inconvenient and can increase unnecessary financial burden and the risk of spread of the disease.
The RT-PCR test may show false negativity due to various reasons. Studies have shown that chest CT has a high sensitivity for the diagnosis of COVID-19. A patient with high clinical suspicion of COVID-19 infection with a history of contact should not be removed from isolation without a CT scan, even if RT-PCR tests are negative. In severe cases, where viral loads are higher with lower CT values, we recommend a CT scan to detect the spread of infection and tissue damage. We do not recommend any change in standard COVID-19 practices and the RT-PCR test should remain the first step in the diagnosis of COVID-19 considering its less harmful effects and practicality.
Conclusion
In conclusion, a chest CT scan is superior in sensitivity for the detection of COVID-19 than that of RT-PCR. However, considering the risk of episodes of exposure to radiation and the practicality of the technique, RT-PCR remains the standard reference test for the diagnosis of the disease. The use of a CT scan should be limited as a confirmatory diagnostic test in the case of COVID-19 suspects whose RT-PCR test results are negative.
Source of Funding
This research did not receive any funding.
Conflict of Interest
The author has no conflict of interest to declare.
References
- I Korkmaz, N Dikmen, FO Keleş, T Bal. Chest CT in COVID-19 pneumonia: correlations of imaging findings in clinically suspected but repeatedly RT-PCR test-negative patients. Egypt J Radiol Nuclear Med 2021. [Google Scholar]
- A Vitullo, MC DeSantis, A Marchianò, R Valdagni, L Lozza. The simulation-CT: Radiotherapy's useful tool in the race against COVID-19 pandemic. A serendipity approach. Radiother Oncol 2020. [Google Scholar]
- T Ai, Z Yang, H Hou, C Zhan, C Chen, W Lv. Correlation of Chest CT and RT-PCR Testing for Coronavirus Disease 2019 (COVID-19) in China: A Report of 1014 Cases. Radiology 2020. [Google Scholar]
- HX Bai, B Hsieh, Z Xiong, K Halsey, JW Choi, TML Tran. Performance of Radiologists in Differentiating COVID-19 from Non-COVID-19 Viral Pneumonia at Chest CT. Radiology 2020. [Google Scholar]
- X Meng, Y Liu. Chest Imaging Tests versus RT-PCR Testing for COVID-19 Pneumonia: There Is No Best, Only a Better Fit. Radiology 2020. [Google Scholar]
- JV Waller, P Kaur, A Tucker. Diagnostic Tools for Coronavirus Disease (COVID-19): Comparing CT and RT-PCR Viral Nucleic Acid Testing. AJR Am J Roentgenol 2020. [Google Scholar]
- R Yang, X Li, H Liu, Y Zhen, X Zhang, Q Xiong. Chest CT Severity Score: An Imaging Tool for Assessing Severe COVID-19. Radiol Cardiothorac Imaging 2020. [Google Scholar]
- BD Kevadiya, J Machhi, J Herskovitz, MD Oleynikov, WR Blomberg, N Bajwa. Diagnostics for SARS-CoV-2 infections. Nat Mater 2021. [Google Scholar]
- J Martin, N Tena, AG Asuero. Current state of diagnostic, screening and surveillance testing methods for COVID-19 from an analytical chemistry point of view. Microchem J 2021. [Google Scholar] [Crossref]
- GD Braunstein, L Schwartz, P Hymel, J Fielding. False positive results with SARS-CoV-2 RT-PCR tests and how to evaluate a RT-PCR-positive test for the possibility of a false positive result. J Occup Environ Med 2021. [Google Scholar]
- HA Gietema, N Zelis, JM Nobel, LJ Lambriks, LBV Alphen, AMO Lashof. CT in relation to RT-PCR in diagnosing COVID-19 in The Netherlands: A prospective study. PLoS One 2020. [Google Scholar] [Crossref]
- A Kohli, A Joshi, A Shah, RD Jain, A Gorlawar, A Dhapare. Does CT help in reducing RT-PCR false negative rate for COVID-19?. Indian J Radiol Imaging 2021. [Google Scholar]
- I Yoon, TL Slesinger. . Radiation exposure in pregnancy [Internet] 2019. [Google Scholar]
